

Companies rise and fall based on their ability to anticipate and react to consumer needs, which becomes glaringly apparent in the hypercompetitive internet landscape. Your online business’s success hinges on your website’s ability to adapt, evolve, and anticipate your consumers’ behavior and needs.
Unfortunately, there isn’t a magical crystal ball or an oracle that can spout out prophetic insights to help you chart the course of your online business… or is there? Ladies and gentlemen, let me introduce you to the fantastic little something called web analytics.
Table of Contents
What is Web Analytics?
So, what the heck is web analytics?
Avinash Kaushik, in his book “Web Analytics: An Hour a Day“, described it as –
Ok, so web analytics is all about analyzing data to gain more conversions and get you the wins you need – got it – but where do you get the data from?
Here’s where tools like Google Analytics come in. They help generate quantitative data called “clickstream data”, which can show you data like how many visitors visit a website, how long they stay, how many pages they view, and whether they arrived by following a link or not.
How Clickstream Analytics Solutions Work

Clickstream analytics solutions “tag” web pages by adding a small piece of JavaScript to their code.
With these tags, the analytics tool can keep track of every visitor to the page, and their link clicks. The tag can also collect information about the device and browser, and using the IP address, identify the user’s geolocation.
Most web analytics solutions use cookies to keep track of each session and see if the same browser has been there more than once.
What are the 4 Key Clickstream Metrics That You Should Track?
The number of user behaviors on your website that you can track with the help of clickstream data is honestly endless. But to keep things simple, let’s look at four key behaviors you can measure.
Total Traffic
The number of people who visit your site in a given amount of time is called its “total traffic”, and is a way to measure your website’s health.
Let’s say 60 people visit your site every day. Those are bad numbers if your site has been around for a year. But conversely, if you opened up shop just a month ago, those figures aren’t too shabby. In other words, keeping an eye on your traffic and how it changes over time is essential.
Your site traffic should grow along with your website. If your traffic stays the same or goes down over time, you aren’t doing something right. Search Engine Optimization (SEO) is an excellent place to start when you want to increase your site traffic.
Source of Traffic
Most of the time, people who have never been to your website tend to find it through links instead of by typing in your URL. These pages that link to your site are what we refer to as the source of traffic, and they usually fall into four groups:
- Search engines
- Links from other sites
- Leads from email campaigns
- Links from social media
In general, you want to increase traffic from all four different sources, with search engines being where you would focus your major efforts, as they can bring in significant amounts of traffic.
Bounce Rate
In analytics, a “bounce” occurs when a user views your site but does not navigate to other pages.
A high bounce rate often indicates something is wrong with your website. For example, say your bounce rate is 60%: it suggests that three out of every five visitors to your site don’t stick around.
That could be for many different reasons; a lack of relevance in the content, complex navigation, or off-putting use of sound effects and visuals. As a general rule, aim for a bounce rate of less than 50%. But try to do everything you can to keep it as low as possible.
Conversion Rates
When a site visitor completes a call-to-action, it’s considered a conversion.
A website conversion might be anything from a newsletter signup to a completed purchase. Conversions get measured as a percentage of the traffic to your site: the higher your conversion rates, the better.
These four metrics provide an excellent launchpad for your analytics efforts. However, as much as clickstreams provide actionable data, it only acts as part of the equation. You still need good qualitative data for successful web analytics.
Experience the Best in Search Solutions with AddSearch – Top Rated on SourceForge! Click for Your Free, Personalized Demo Now.

While quantitative data indicates what happens on your website, qualitative data explains the “why”. It assesses actions and the factors that motivate them.
Qualitative Data
You can compile qualitative data from various sources, the best being search analytics.

Search Analytics
Search analytics is the process of gathering, arranging, and sharing information on how people use search engines.
Your search engine provides the most direct statement of what your target audience or consumers desire, by offering you unique insight into how people interact with it.
Most modern site search solutions, such as AddSearch, offer search analytics tools and can be easily connected to popular clickstream data tools like Google Analytics.
As with clickstream analytics, a plethora of data types can be gleaned through search analytics; however, for brevity’s sake, let’s look at one of the main types of user behavior data that search analytics can offer.
(The available metrics, features, and how they are presented and accessed depend on which solution you use. For this blog post, we’ll be looking at these search analytics metrics and capabilities through the lens of an AddSearch user. )
Keyword Data
We search using keywords, and that’s a fact. It’s a fact that’s unlikely to change anytime soon. Understanding the vernacular used by your site visitors can help you create richer and more relevant content online and offline.
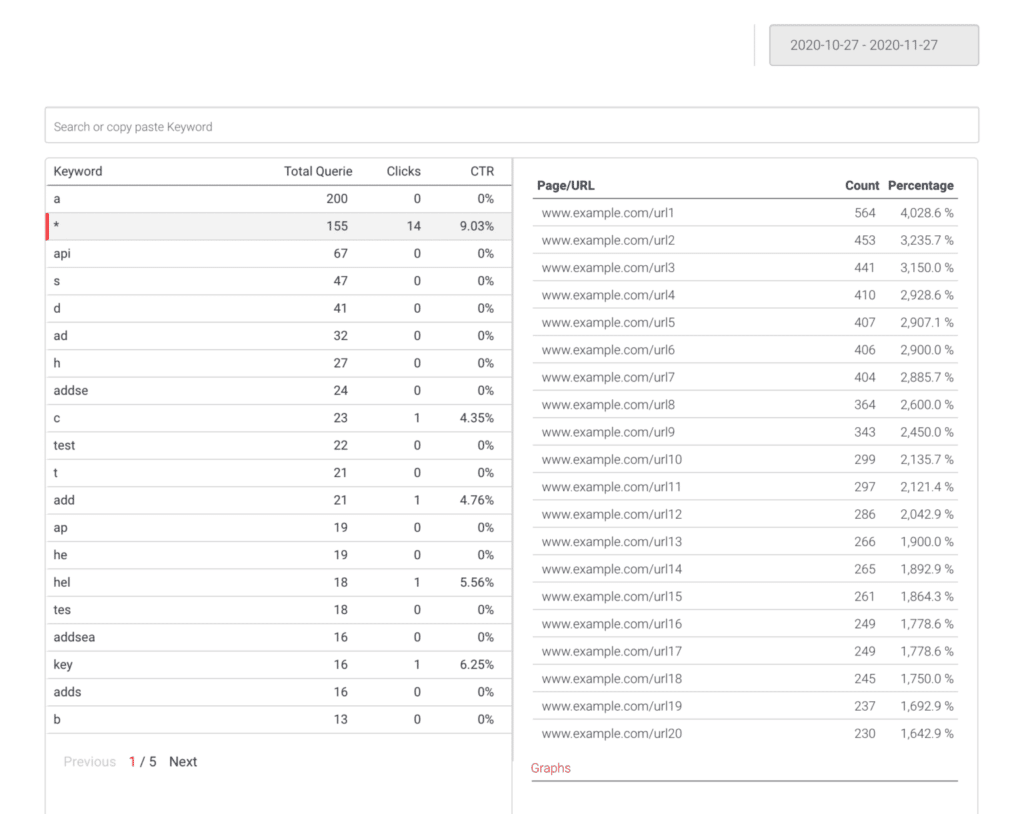
The keyword analytics data offered by AddSearch can be organized and presented in multiple ways, offering it to you in easily digestible categories, ensuring that you don’t get bogged down by information overload.
Here are three of the more crucial keyword metrics offered:

Popular keywords –
This data is extremely valuable in informing your content creation. When you see a majority of users searching for the same thing, it’s a clear indication that the content related to that keyword needs to be prioritized.

Low CTR keywords –
If users don’t click on any of the listed results in their searches (or barely do), that’s a sign for you to take countermeasures.
Keywords with low CTR indicate that while visitors may well get results for their search, they don’t see any valuable information offered, so don’t click on anything. And wouldn’t you agree that irrelevant search results are just as bad as showing no results at all?

No-results keywords –
Keywords that don’t return results indicate where your content is lacking. This may be because you simply don’t have the requested information on your website or because users use different keywords for their search than you.
What are some of the best practices in web analytics?
Now that you know which metrics to look at, here are some web analytics best practices to implement:
1. Establish Specific Goals and Objectives.
First and foremost, you must identify what you want to accomplish with your site. After that, you’ll be able to configure your web analytics to gather the data relevant to that purpose.
Assume you own a B2B firm and your primary aim is to create leads through your website. With this in mind, you’ll know that merely tracking the number of visits to your website isn’t enough. You’ll also need to configure your tool to track how many form submissions you receive.
2. Design Your Own Dashboards
You’ll be able to construct custom dashboards to monitor important KPIs if you’re using Google Analytics. If you’re stuck for ideas, browse the Solutions Gallery, which contains a plethora of ready-to-use dashboard designs provided by other users.
3. Utilize Filters
Your internal staff (particularly your engineers or tech team!) are most likely regular visitors to your website. Configure your web analytics application to exclude traffic from your workplace IPs to avoid having their visits skew your results.

4. Don’t Neglect Search Analytics
Search analytics offers you valuable qualitative data. It deals more with analyzing the “why” and “what for” of user behavior than merely quantifying the data. It plays a crucial part in guiding your content creation.
Search analytics is, without a doubt, the Robin to clickstream analytics’ Batman.
Conclusion
Data minable through web analytics is endless, but not all of that data would necessarily yield actionable information. So, the goal is to pay attention to the metrics that directly affect your return on investment.
Talk to our team of experts to get more insight on how you can get the most out of your site search analytics and experience.

Contact our sales team to explore how to increase conversions, reduce helpdesk costs and make your customers happy.